| About | Advertising | Email CR | Graph Galleries | Tanta | Weekly Schedule | Sponsored Offers | Subscribe via email |  Twitter | Twitter |  RSS Feed RSS Feed |
Monday, March 28, 2011
Neutron Loans hit California City
by CalculatedRisk on 3/28/2011 07:24:00 PM
I'm reminded of this quote:
“All of the old-timers knew that subprime mortgages were what we called neutron loans — they killed the people and left the houses,” said Louis S. Barnes, 58, a partner at Boulder West, a mortgage banking firm in Lafayette, Colo. ... from a 2007 NY Times article (pay)
And from the O.C. Register today: Vacant homes a clue to Santa Ana's census drop
A big jump in the number of vacant homes could be a key to understanding this city's surprising drop in population as recorded by the 2010 census.Some probably double up. Another earlier article suggested some former residents may have moved back to Mexico. But the reason is neutron loans ...
...
Santa Ana's drop, in raw numbers, was the largest of any California city.
...
The census counted 76,896 housing units in Santa Ana and determined that 3,722 of them were vacant. [CR Note: the 2000 Census showed 74,588 housing units in Santa Ana and 1,586 vacant. So the vacancy rate more than doubled]
Among cities in Orange County, Santa Ana had among the highest concentrations of mortgage defaults in 2009, which could explain why the census found so many vacant homes in 2010.
... it's unclear where the people who left behind vacant homes went, since other states didn't show big influxes of people from California, [John Malson, acting chief of the demographic research unit at the Department of Finance] said. ... "We assumed a lot of people were moving back home or doubling up," he said. "It just seems that there might be a missed population from the census."
Personal Saving Rate and Income less Transfer Payments
by CalculatedRisk on 3/28/2011 03:43:00 PM
A couple more graphs based on the Personal Income and Outlays report.
 Click on graph for larger image in graph gallery.
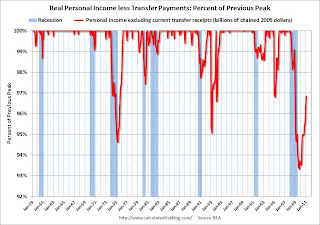
This first graph shows real personal income less transfer payments as a percent of the previous peak. This has been slow to recover - and real personal income less transfer payments declined slightly in February. This remains 3.2% below the previous peak.
The personal saving rate decreased to 5.8% in January.
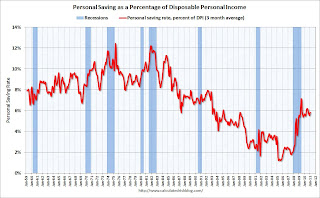 This graph shows the saving rate starting in 1959 (using a three month trailing average for smoothing) through the February Personal Income report.
When the recession began, I expected the saving rate to rise to 8% or more. However that was just a guess. After increasing sharply during the recession, the saving rate has been mostly moving sideways for the last two years - so spending growth has mostly kept pace with income growth, and that will probably continue all year.
 Click on graph for larger image in graph gallery.
This first graph shows real personal income less transfer payments as a percent of the previous peak. This has been slow to recover - and real personal income less transfer payments declined slightly in February. This remains 3.2% below the previous peak.
The personal saving rate decreased to 5.8% in January.
Personal saving -- DPI less personal outlays -- was $676.7 billion in February, compared with $710.5 billion in January. Personal saving as a percentage of disposable personal income was 5.8 percent in February, compared with 6.1 percent in January.
 This graph shows the saving rate starting in 1959 (using a three month trailing average for smoothing) through the February Personal Income report.
 When the recession began, I expected the saving rate to rise to 8% or more. However that was just a guess. After increasing sharply during the recession, the saving rate has been mostly moving sideways for the last two years - so spending growth has mostly kept pace with income growth, and that will probably continue all year.
Here come the downgrades for Q1 GDP Growth
by CalculatedRisk on 3/28/2011 12:50:00 PM
Before the February Personal Income and Outlays report, most analysts were expecting real GDP growth of over 3% in Q1. As an example, Paul Kasriel at Northern Trust was forecasting 3.1% real GDP growth with 2.2% real Personal Consumption Expenditure (PCE) growth, and Goldman Sachs was forecasting 3.5% real GDP growth with 3.0% real PCE growth.
Both of those forecast now look too high.
Note: The quarterly change is not calculated as the change from the last month of one quarter to the last month of the next. Instead, you have to average all three months of a quarter, and then take the change from the average of the three months of the preceding quarter.
So, for Q1, you would average PCE for January, February, and March, then divide by the average for October, November and December. Of course you need to take this to the fourth power (for the annual rate) and subtract one. Also the March data isn't released until after the advance Q1 GDP report.
There are a few commonly used methods to forecast quarterly PCE growth after the release of the second month of the quarter report (February for Q1). Some analysts use the "two month" method (averaging the growth from October-to-January with the growth from November-to-February). Others use the mid-month method and just use the growth from November-to-February.
Either way, the first two months of Q1 2011 suggest PCE growth of around 1.4% for the quarter as shown in the following table.
Although there are other components of GDP (investment, trade, government spending and inventory changes), it appears Q1 GDP growth will be lower than expected.
I still expect stronger GDP growth in 2011 than in 2010, but it appears 2011 is off to a sluggish start - and I'm concerned about world events and high oil prices.
Both of those forecast now look too high.
Note: The quarterly change is not calculated as the change from the last month of one quarter to the last month of the next. Instead, you have to average all three months of a quarter, and then take the change from the average of the three months of the preceding quarter.
So, for Q1, you would average PCE for January, February, and March, then divide by the average for October, November and December. Of course you need to take this to the fourth power (for the annual rate) and subtract one. Also the March data isn't released until after the advance Q1 GDP report.
There are a few commonly used methods to forecast quarterly PCE growth after the release of the second month of the quarter report (February for Q1). Some analysts use the "two month" method (averaging the growth from October-to-January with the growth from November-to-February). Others use the mid-month method and just use the growth from November-to-February.
Either way, the first two months of Q1 2011 suggest PCE growth of around 1.4% for the quarter as shown in the following table.
| PCE, Billions (2005 dollars), SAAR | 3 Month Change (annualized) | Quarter (Annualized) | |
|---|---|---|---|
| Jan-10 | $9,189.30 | ||
| Feb-10 | $9,228.20 | ||
| Mar-10 | $9,258.60 | ||
| Apr-10 | $9,257.20 | 2.99% | |
| May-10 | $9,280.50 | 2.29% | |
| Jun-10 | $9,289.30 | 1.33% | 2.2% |
| Jul-10 | $9,302.60 | 1.98% | |
| Aug-10 | $9,333.90 | 2.32% | |
| Sep-10 | $9,355.40 | 2.88% | 2.4% |
| Oct-10 | $9,402.80 | 4.38% | |
| Nov-10 | $9,426.60 | 4.03% | |
| Dec-10 | $9,439.30 | 3.64% | 4.0% |
| Jan-11 | $9,435.10 | 1.38% | |
| Feb-11 | $9,459.00 | 1.38% | |
| Mar-11 |
Although there are other components of GDP (investment, trade, government spending and inventory changes), it appears Q1 GDP growth will be lower than expected.
I still expect stronger GDP growth in 2011 than in 2010, but it appears 2011 is off to a sluggish start - and I'm concerned about world events and high oil prices.
Texas Manufacturing Activity Strengthens Further, Pending Home sales increase in February
by CalculatedRisk on 3/28/2011 10:30:00 AM
• From the Dallas Fed: Texas Manufacturing Activity Strengthens Further
• From the NAR: February Pending Home Sales Rise
Texas factory activity increased in March, according to business executives responding to the Texas Manufacturing Outlook Survey. The production index, a key measure of state manufacturing conditions, rose sharply to 24, its highest level in nearly a year.Another strong report. The last of the regional reports will be released on Thursday, and the ISM manufacturing index will be released on Friday (should be very strong again).
...
Labor market indicators continued to reflect expansion. The employment index came in at a reading of 12, similar to February. Twenty percent of manufacturers reported hiring new workers compared with eight percent reporting layoffs. The hours worked index jumped to 13, with the share of firms reporting decreases in employee workweeks falling to its lowest level since 2006. The wages and benefits index rose from 9 to 12, although the great majority of respondents noted no change in labor costs.
• From the NAR: February Pending Home Sales Rise
The Pending Home Sales Index,* a forward-looking indicator, rose 2.1 percent to 90.8, based on contracts signed in February, from 88.9 in January. The index is 8.2 percent below 98.9 recorded in February 2010. The data reflects contracts and not closings, which normally occur with a lag time of one or two months.This suggests a slight increase in existing home sales in March and April.
Personal Income and Outlays Report for February
by CalculatedRisk on 3/28/2011 08:30:00 AM
The BEA released the Personal Income and Outlays report for January:
 Click on graph for larger image in graph gallery.
PCE increased 0.7% in February, but real PCE only increased 0.3% as the price index for PCE increased 0.4 percent in February.
Personal income growth was slightly below expectations. Note: Core PCE - PCE excluding food and energy - increased 0.2 percent in February.
Even though PCE growth was at expectations, real PCE was low - and this suggests analysts will downgrade their forecasts for Q1 GDP. Using the two month estimate for PCE growth (averaging the growth of January and February over the first two months of the previous quarter) suggests PCE growth of around 1.4% in Q1 (down sharply from 4.0% in Q4).
Weekend on U.S. economy:
• Here is the Summary for Week ending March 25th.
• Lawler: Census 2010 and Excess Vacant Housing Units
• Schedule for Week of March 27th
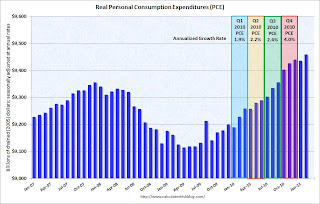
Personal income increased $38.1 billion, or 0.3 percent ... Personal consumption expenditures (PCE) increased $69.1 billion, or 0.7 percent.The following graph shows real Personal Consumption Expenditures (PCE) through January (2005 dollars). Note that the y-axis doesn't start at zero to better show the change.
...Real PCE -- PCE adjusted to remove price changes -- increased 0.3 percent in February, in contrast to a decrease of less than 0.1 percent in January.
 Click on graph for larger image in graph gallery.
PCE increased 0.7% in February, but real PCE only increased 0.3% as the price index for PCE increased 0.4 percent in February.
Personal income growth was slightly below expectations. Note: Core PCE - PCE excluding food and energy - increased 0.2 percent in February.
Even though PCE growth was at expectations, real PCE was low - and this suggests analysts will downgrade their forecasts for Q1 GDP. Using the two month estimate for PCE growth (averaging the growth of January and February over the first two months of the previous quarter) suggests PCE growth of around 1.4% in Q1 (down sharply from 4.0% in Q4).
Weekend on U.S. economy:
• Here is the Summary for Week ending March 25th.
• Lawler: Census 2010 and Excess Vacant Housing Units
• Schedule for Week of March 27th
 |
POSTS TODAY
POSTS YESTERDAY
Archive
Economist's View
Econbrowser
Paul Krugman
Economix
Lansner on Real Estate
macroblog
The Baseline Scenario
Grasping Reality with Opposable Thumbs
Capital Gains and Games
Beat the Press
China Financial Markets
Housing Wire
The Big Picture
naked capitalism


Labels
Alt-A (15) ARM Resets (26) auto (209) Bank Failure (335) Bankruptcy (104) Cancellations (22) cartoons (28) CDO (22) Confessional (243) Construction Spending (45) Counterparty Risk (95) CRE (559) Credit Cards (40) Credit Crunch (170) DataQuick (55) default (56) delinquency (111) Demographics (5) Employment (370) Existing Home Inventory (118) Existing Home Sales (200) Fannie Mae (56) FDIC (474) Fed Funds Rate (68) Fed Speeches (122) FHA (51) Foreclosure (270) Freddie Mac (68) GDP (41) GSEs (49) HELOC (19) HMDA (2) Home Improvement (23) House Prices (294) Housing Starts (80) humor (94) MBA (81) MEW (52) MMI (28) Mortgage (60) Mortgage Fraud (45) mortgage rates (67) NAHB (58) Negative Equity (44) New home inventory (70) New Home Sales (123) non-residential investment (59) oil (72) Option ARM (38) PCE (75) Picking On Poor Gretchen (11) Pier Loans (42) Rating Agencies (86) Recession (234) Regulatory (110) Rental Market (51) REO (52) Residential Investment (35) retail (124) Securitization (27) Subprime (27) The Mother of All Bailouts (131) Trade Deficit (77) Weekly Summary (61) 

Economic Sites
- A Dash of Insight
- Angry Bear
- Bonddad Blog
- Boom2Bust
- Brad DeLong's Website
- Businomics Blog
- Capital Observer
- Dismal Scientist
- Econbrowser
- Economic Logic
- Economic Videos
- Economist`s View
- Eschaton
- Expect[ed] Loss
- FFS Blog
- Financial Armageddon
- Futronomics
- FX Trading Ideas
- Gauging Corporate Financial Results
- Hedge Fund Implode
- Hilo Living
- IMF Direct
- Insider News, Stocks, Brazil
- Interest Rate Roundup
- International Political Economy Zone
- Jesse's Café Américain
- Killer Buffalo
- Krugman: Conscience of a Liberal
- Macroblog (Dr. Altig)
- Market Rubbernecker
- MarketObservation.com
- Michael Comeau
- Mish's Global Economic Analysis
- Mock The Market
- Money is the way
- Money-Rx Blog
- MV=PQ
- My Finance Times
- My Stock Market Power
- naked capitalism
- New Economist
- Nouriel Roubini's Blog
- Paul Krugman Archive
- Prince of Wall Street
- Private Equity
- Rebel Traders
- Reggie Middleton's Boom, Bust & Bling Blog
- Robert Salomon, NYU Professor
- Rogue Economist Rants
- Samwick's Vox Baby
- Short Interest
- Skeptical CPA
- Stefan Karlsson's Blog
- Stock Buster (in Portuguese)
- Stripnomics
- The Big Picture
- The Daily Asker
- The Economic Populist
- The Enlightened American
- The Epicurean Dealmaker
- The Great Depression of 2006
- The Mess That Greenspan Made
- The Money Blogs
- The Pendulum Swings: Asian Finance
- The Sovereign Speculator
- The Yellow Brick Road
- Trading in Blog (Portuguese)
- Transaction Level Analysis
- W.C. Varones Blog
- Wandering around Financial Cities
- William Polley
- Yes and Not Yes
- Zacks
Housing Sites
- Bubble Meter
- Chicago Mortgage Loans
- Deal Junkie (Commercial)
- Dr. Housing Bubble
- Effective Demand
- FHA Mortgage Guide (unofficial)
- Homes’ Mispricing: Straight Lines!
- Housing Chronicles
- Housing Derivatives
- Housing Doom
- Housing News and Economics
- Housing Videos
- Housing Wire
- How To Get Home, Savannah
- immobilienblasen
- Investment Properties
- Irvine Housing Blog
- KeNo's Housing and Economic Portal
- Loan Modification News
- Manhattan Beach Confidential
- Market Trends Alabama Real Estate
- Matrix: Real Estate Economy
- May 5th and Everything After
- Medina Report, Twin Cities
- Miami Condo Forum
- Mortgage Lender Implode O Meter
- Mortgage News Clips
- Mortgage REIT Journal
- Mortgage1A.com
- MortgageDataWeb
- National Bubble
- NJ HELOC Heaven
- NJ Real Estate Report
- NY City Urbandigs
- Option Armageddon
- Paper Economy
- Portland Housing Blog
- Prof. Pigginton's Econo-Almanac
- RE in the LBC, Long Beach, CA
- Real C'ville - The Bubble Blog
- Real Estate Realist
- Reitwrecks.com
- Reverse Mortgage Daily
- Reverse Mortgage Guide
- Reverse Mortgage Information
- Reverse Mortgage Lenders
- Sacramento Area Flippers In Trouble
- Sacramento Real Estate Statistics
- San Diego Housing Forecast
- San Fernando Valley Real Estate
- Santa Monica Distress Monitor
- Seattle Bubble
- Short Sale Blogger
- Socal Bubble
- Stop Foreclosure Blog
- The Great Loan Blog
- thetruthaboutmortgage.com
- Trendocracy
- UK Housing Bubble
- Westside Bubble blog