
You may only read this site if you've purchased Our Kampf from Amazon or Powell's or me
• •
"Mike and Jon, Jon and Mike—I've known them both for years, and, clearly, one of them is very funny. As for the other: truly one of the great hangers-on of our time."—Steve Bodow, head writer, The Daily Show
•
"Who can really judge what's funny? If humor is a subjective medium, then can there be something that is really and truly hilarious? Me. This book."—Daniel Handler, author, Adverbs, and personal representative of Lemony Snicket
•
"The good news: I thought Our Kampf was consistently hilarious. The bad news: I’m the guy who wrote Monkeybone."—Sam Hamm, screenwriter, Batman, Batman Returns, and Homecoming
March 24, 2011
A Geographical Note About the Infant Death Rate at TMI
By: Aaron Datesman
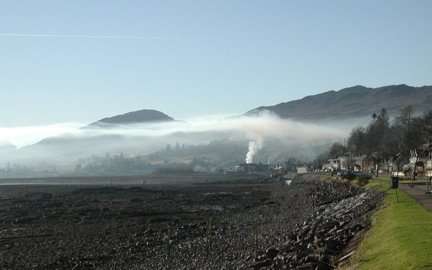
You may be aware of the London Big Smoke, which killed about 12,000 people in 1952. It was caused by a temperature inversion: a layer of cold, stagnant air trapped under a lid of warm air. This phenomenon can temporarily halt convective transport in the atmosphere locally: that is, it prevents the atmosphere from mixing (and prevents dispersion of pollutants). The mechanics are similar to the considerations Thomas Jefferson made for siting Monticello, which I mentioned in comments here. Wikipedia has a nice picture of the effects of a temperature inversion over a factory in Scotland, below. Note how the factory effluent fails to cross the boundary between the cold, dense layer near the ground and the warmer cap above.
Generally the atmosphere is warmer closer to the earth, since air is transparent to sunlight and warmed from below. The temperature of the air is a balancing act between the energy incident from the sun and the thermal energy radiated by the earth. Although temperature inversions don’t ordinarily kill thousands of people, they are common. They are most common a) at night, and b) in winter, when the sun provides a lower density of incident energy.
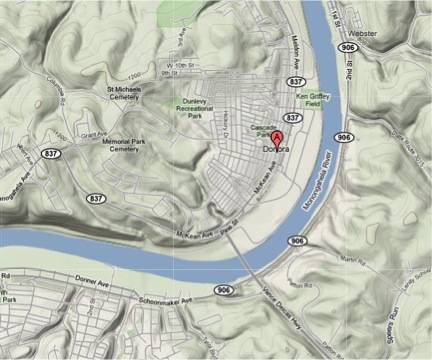
An event similar to the Big Smoke occurred in Donora, PA, on October 27, 1948. The Donora Smog killed 20 people and 800 animals, and was one of the precipitating events leading to passage of the Clean Air Act in 1970. Donora is in the Monongahela River Valley south of Pittsburgh. I worked in nearby Charleroi, PA for a while in 2006. This is a topographic map of the Mon Valley around Donora. You will certainly notice the hills on both sides of the river, with Donora tucked into a flat spot on the west bank. That a strong temperature inversion would occur in this terrain is hardly surprising. In fact, I suspect that at least mild inversions are probably common in the Mon Valley at night in fall and winter, since cold, dense air will slide off of the hills and down into the trough of the river, displacing warm air.
This is a topographic map of the area around Three Mile Island and Harrisburg, PA. Three Mile Island is in the lower right, on the island labeled “Susquehanna River”. It is somewhat more hilly in the Mon Valley than around Harrisburg, but the difference is accentuated because the scales on the maps are different. It’s pretty hilly in the Susquehanna Valley around Harrisburg, too.
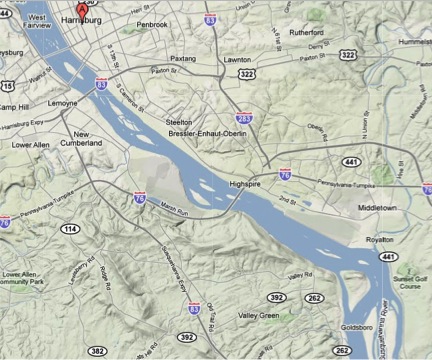
Therefore, I have a reasonable suspicion that temperature inversions frequently occur on the river on cold fall and winter days (and at night) in the area around Harrisburg. (I think Thomas Jefferson, who knew a few things, would back me up on this.) This would prevent emissions (including permitted emissions of radioactive gases – yes, there are such things, and quite a lot of them actually) from the reactors at Three Mile Island from dispersing to the wider atmosphere, as shown with the smoke in the picture from Scotland above.
Instead, fallout (I fail to see the difference between fallout and “emissions”) would most likely settle in the immediate vicinity of TMI. Depending on the exact characteristics of the warm cap layer in the inversion, the flat plain on which Harrisburg sits is a very likely destination.
This is the infant death rate data from Wasserman and Solomon quoted in an earlier post. The interesting question is, do the high infant mortality rates in Harrisburg in fall and winter really have a sociological explanation? I find it disturbing that there’s not a corresponding trend in the state-level data. (The rate does dip a bit in the summer.)
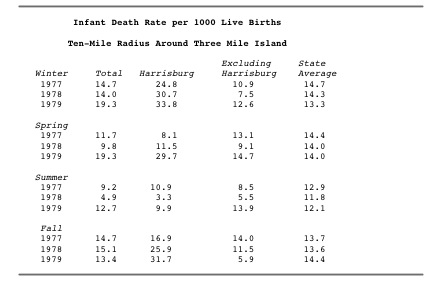
A plausible hypothesis, it seems to me, is that this data covers information from two discrete sets of fallout events. The first is the accident at TMI-2, in spring 1979. The second set of fallout events correspond to routine emissions from TMI-1, trapped along the river by atmospheric inversion layers and deposited in Harrisburg as fallout. This hypothesis explains the puzzling seasonal variation. TMI-1, which appears to have had an excellent official safety record, opened in 1974.
This is from the prologue to the Marie Holowka interview in the TMIA archives:
The Holowka’s have had many animal problems on their farm since the time TMI began operation in 1974.
The hypothesis is testable, of course: it could easily be disproved using data like that in the chart from the years before 1974. I do not have that data, and so I don’t even intend to offer the hypothesis (although I know that I stated it). Instead, I wrote this post to show how complicated the analysis of emissions and fallout really ought to be. Therefore, when I read statements like that from Dr. Kemper that fission byproducts are light and disperse harmlessly into the atmosphere, I engage in the short daydream that there is a licensing board for physicists, and that I can slap the speaker, and take away his right to integrate.
We would never allow this technology to exist if we really understood all of the complications which necessarily follow, but are never considered.
— Aaron Datesman